Via Kibana Maps
Published Apr 19, 2019
TL;DR
The Kibana Maps app is cool. Explore it yourself!
- Download Elasticsearch and Kibana
- Importing gtfs data to your locally running cluster
- Get started
Kibana Maps
With the v7.0.0 release1, the Kibana team released a beta version of the much anticipated Maps app. It allows visualizing complex and layered geospatial data with all the bells and whistles that is expected in a Kibana app2. With its release, I thought it would be fun to see how to visualize and store GTFS data.
What is GTFS
General Transit Feed Specification (GTFS) provides a well known format for public transit systems and their related transit schedules. The specification provides formats for all common aspects of transit including: stops, times, routes, trips, calendar times, and fares3. These data are provided via static files that also optionally includes geospatial data. This enables useful visualizations and search within transit system data. Google provides an excellent and complete reference. If you want to dig deeper, I recommend starting there.
Bringing GTFS into Elasticsearch
Elasticsearch has supported geospatial data for some time now. But, recent improvements have been impressive. This has enabled easier adoption of geospatial data and more responsive interactions. This made bringing Via’s - my local transit company - GTFS data4 into Elasticsearch a piece of cake.
Formatting and pushing the data
In Elasticsearch, it is best to denormalize your data. Throughout the GTFS data set, there are references to *_id fields for joining data together. I opted for filling in those foreign keys with the actual object where applicable. As for formatting the geospatial data, Elasticsearch supports both geo_point and geo_shape data mappings. For all data with simple *_lat/*_lon fields - an example being stops_lat and stops_lon in stops.txt - I combined them to form a geo_point field. Parsing the provided shapes.txt proved to be slightly more involved.
Each latitude (shape_pt_lat) and longitude (shape_pt_lon) point inside the defined shape are given on separate lines. Each of these lines are to be ordered by their related shape_pt_sequence. The best way to store this particular shape is with a linestring geo_shape. I ran into two issues when parsing this data. One, geo_shape points are stored in lon,lat (X,Y) format - the opposite of geo_point. It took me way too long figure out why my paths were in the middle of Antarctica instead of San Antonio, TX. Two, inside Kibana Maps, support for Well-Known Text (WKT) is currently broken. Consequently, all geo_shapes must be in the GeoJSON format.
Once I had all the data read, it was a simple matter of utilizing elasticsearch-py to push it up.
You can see my whole script and the mappings on github. Python is definitely not my daily language, so please excuse the mess :)
Creating the Map
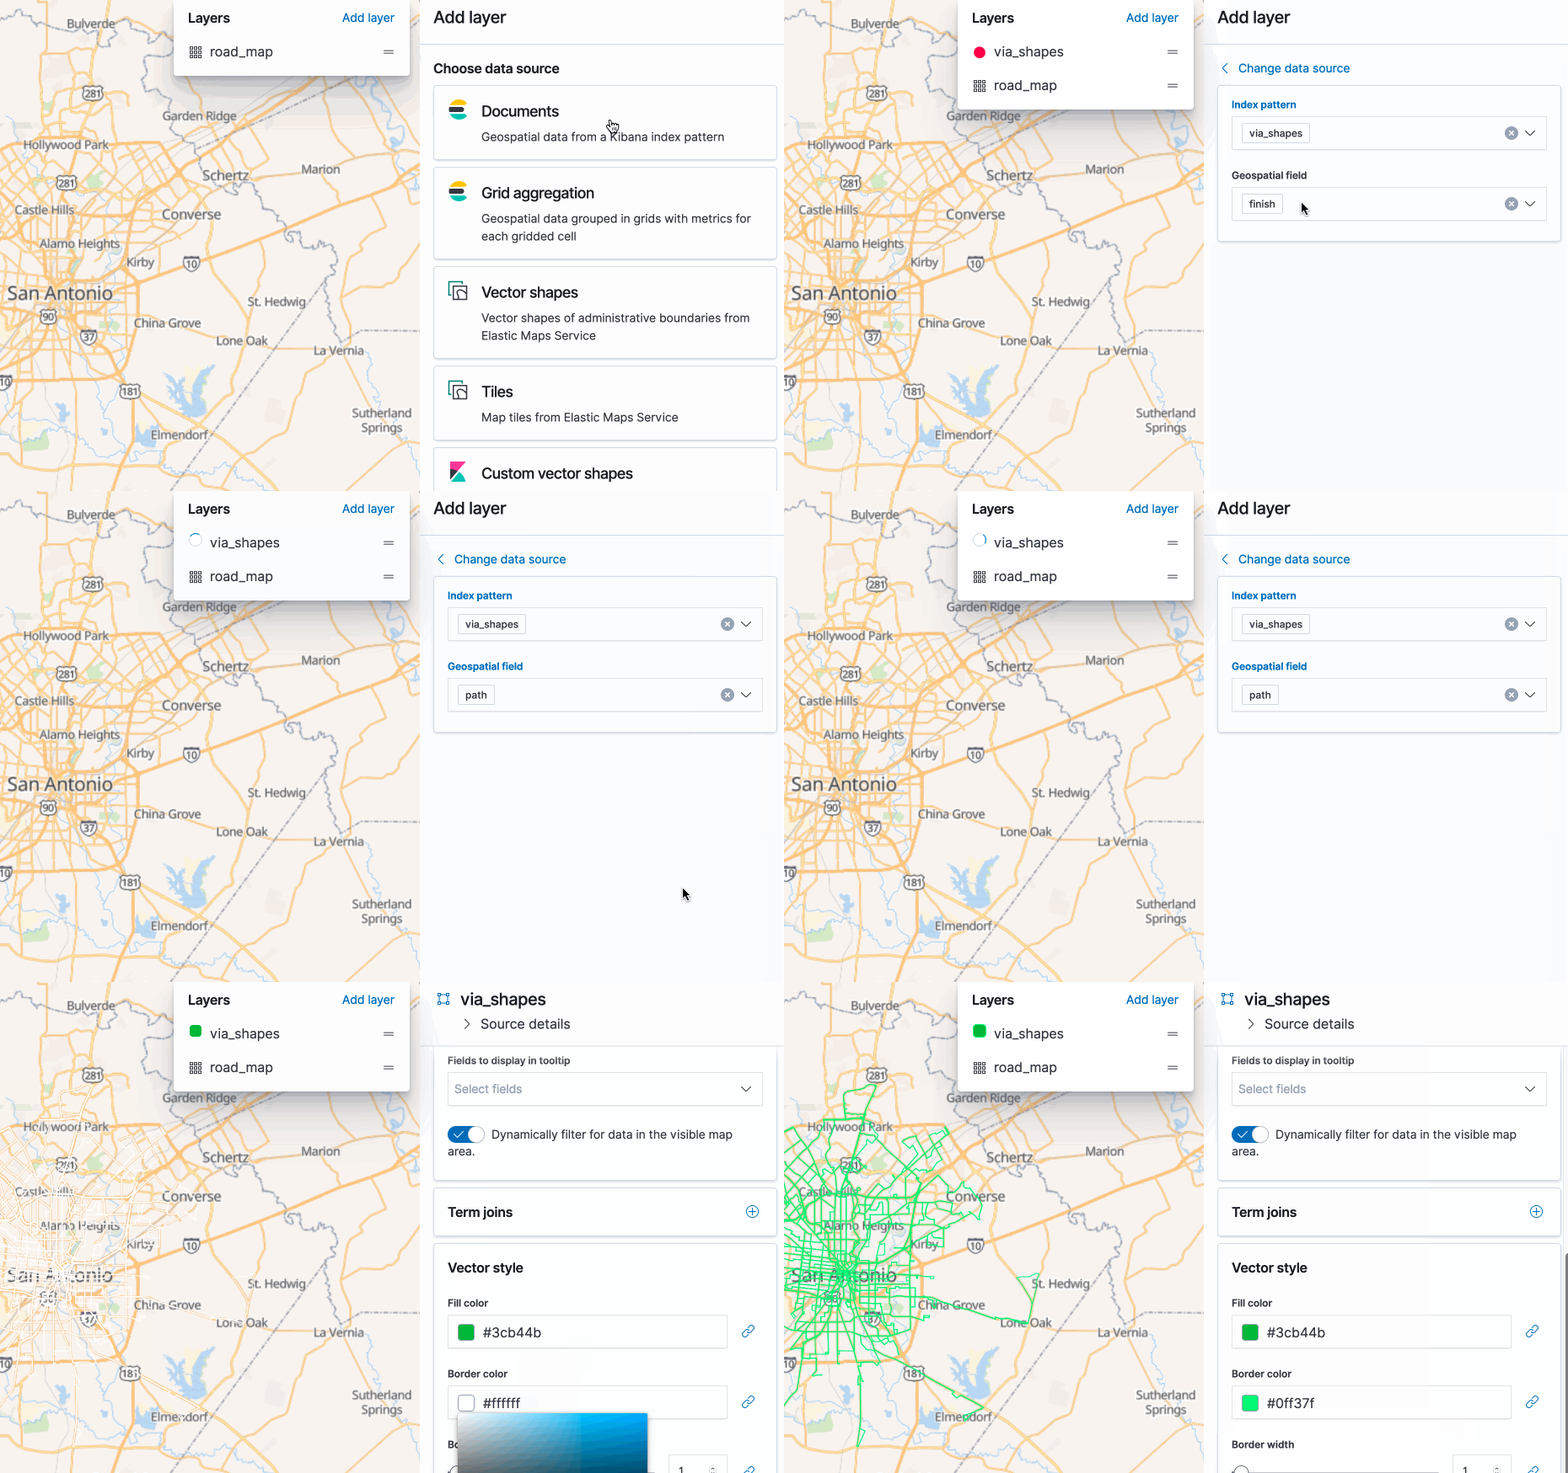
Kibana Maps comes built in with a default vector road map. I used this as my bottom layer. For each consecutive layer, I chose the Documents data source.

With each layer you have options to add a tooltip, adjust the size and color, and even “join” in some more external data to provide more meaning.
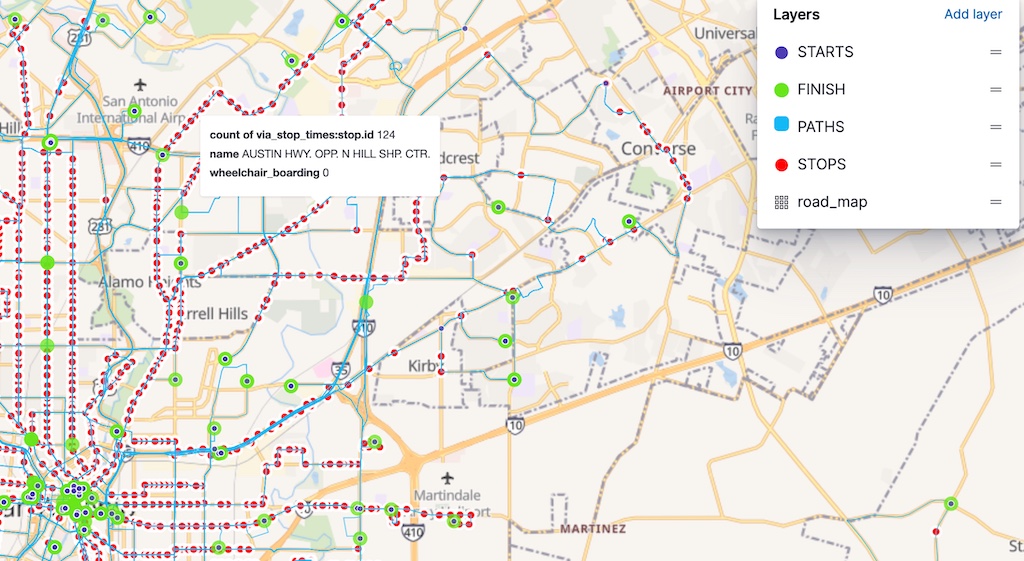
Here is my completed map showing all of Via’s routes in San Antonio, their Stops, Starts and Finishes.
 .
.